Using Qosium is typically either hands-on measuring or automatic monitoring. In monitoring, Qosium observes, for example, that critical services continuously get the QoS they need from the network. Monitoring can range from a single link and application to cover the whole network.
Situational Awareness
The information provided by monitoring for situational awaraness is observed using a results system like Qosium Storage.
Visualize the network status with the QoS heatmap
Set and manage alerts
Daily and weekly reports provide a quick glance to overall situation
Cybersecurity aspects: monitor service availability and traffic flows in critical points of the network
Store, examine, and download raw measurement data
Control measurements for automatic monitoring
Instead of Qosium Storage, you can also use your system that takes in and processes as needed the results created by Qosium. In many use cases, the monitoring results provided by Qosium are enough as such for situational awareness, while in some cases, they are part of a vast set of data provided by different tools.
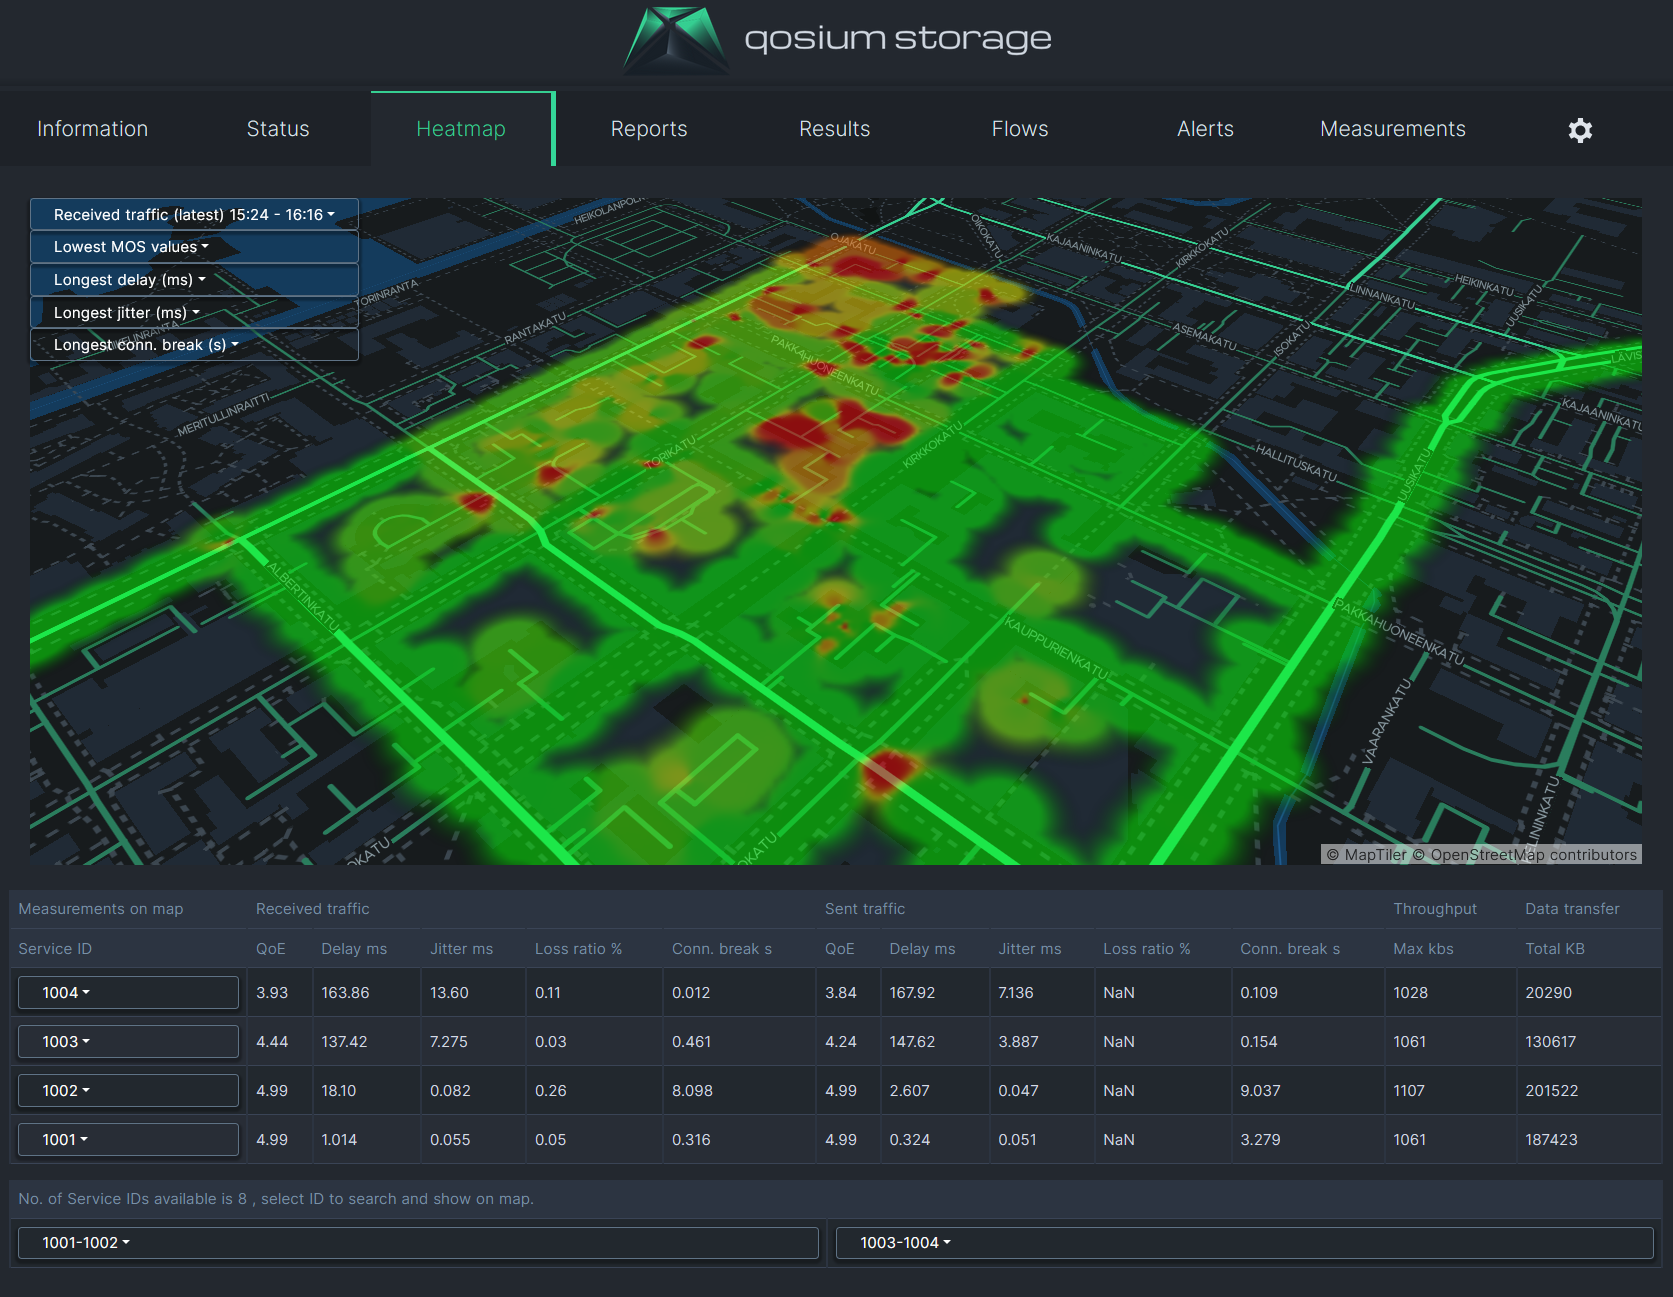
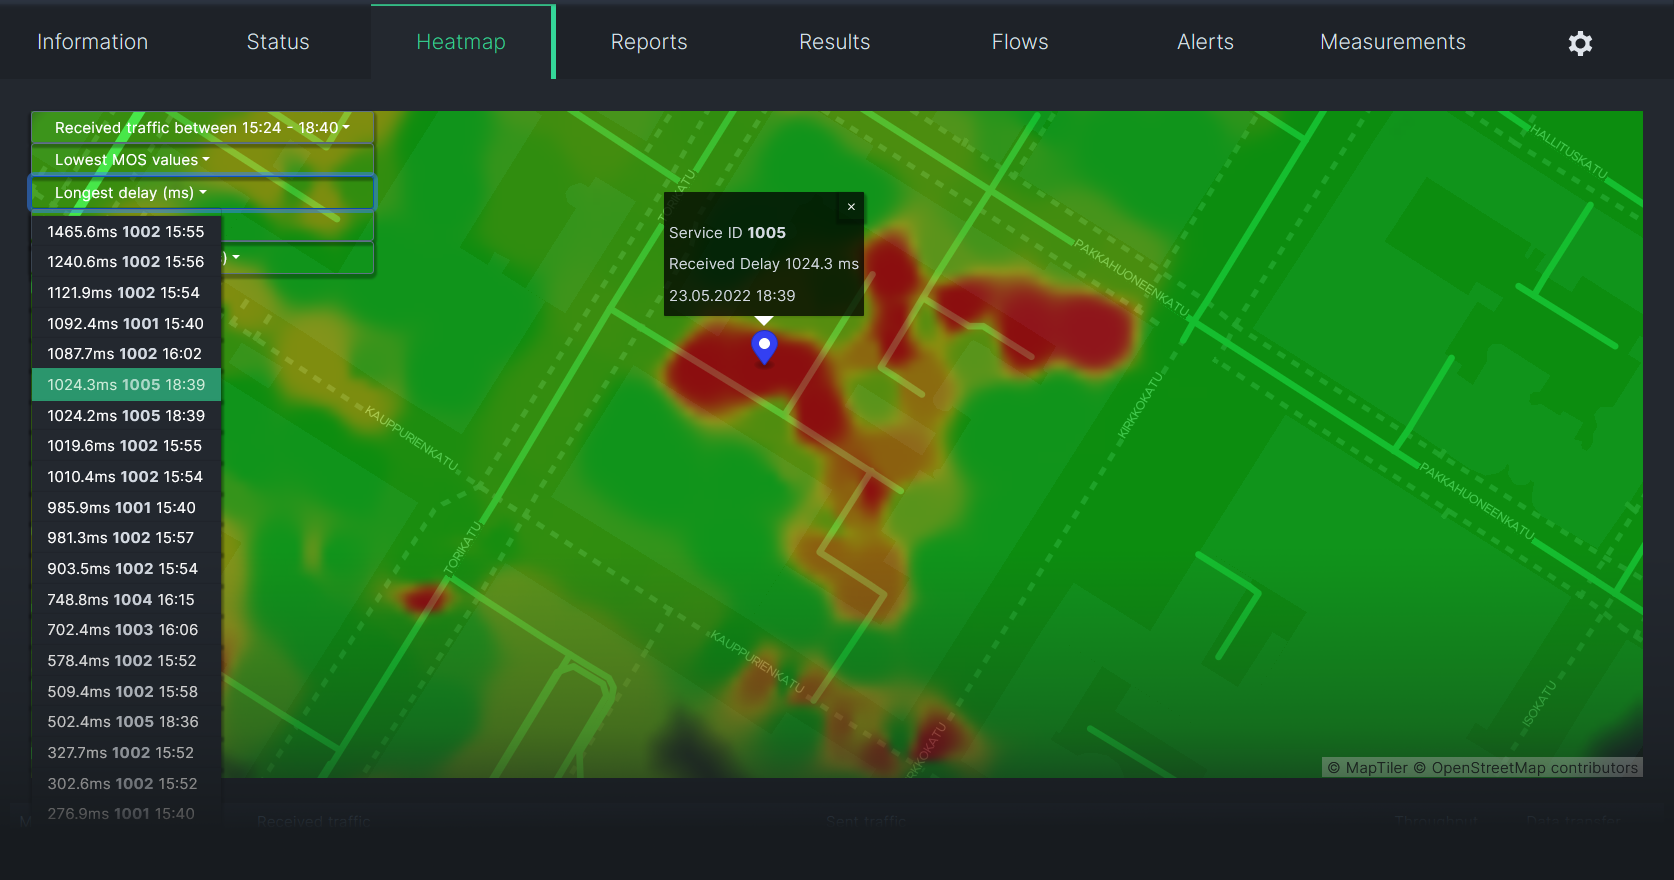
In Qosium Storage’s QoS heatmap visualization, the situational awareness is in its most illustrative form.
Qosium Storage’s heatmap resembles that of Qosium Scope, but while Qosium Scope visualizes a single measurement, it elucidates the monitored system as a whole.
You can visualize all connections, a selected set, or just an individual device’s performance over a selected time scale. Areas of weak QoS are found instantly, and deviant statistics can be pinpointed. Find easily which devices got bad service from the network, where, and when. If the problem is observed only by a single device, the problem is likely somehow related to that. Instead, if other devices also get weak QoS in the same area, it is likely a problem on the network infrastructure side. By going deeper, you can see whether it is about a single base station or a cell. Qosium’s radio interface statistics assist a lot in the root cause hunting: is the issue in radio access part or in the fixed network part?
Detailed Analysis and Interoperability
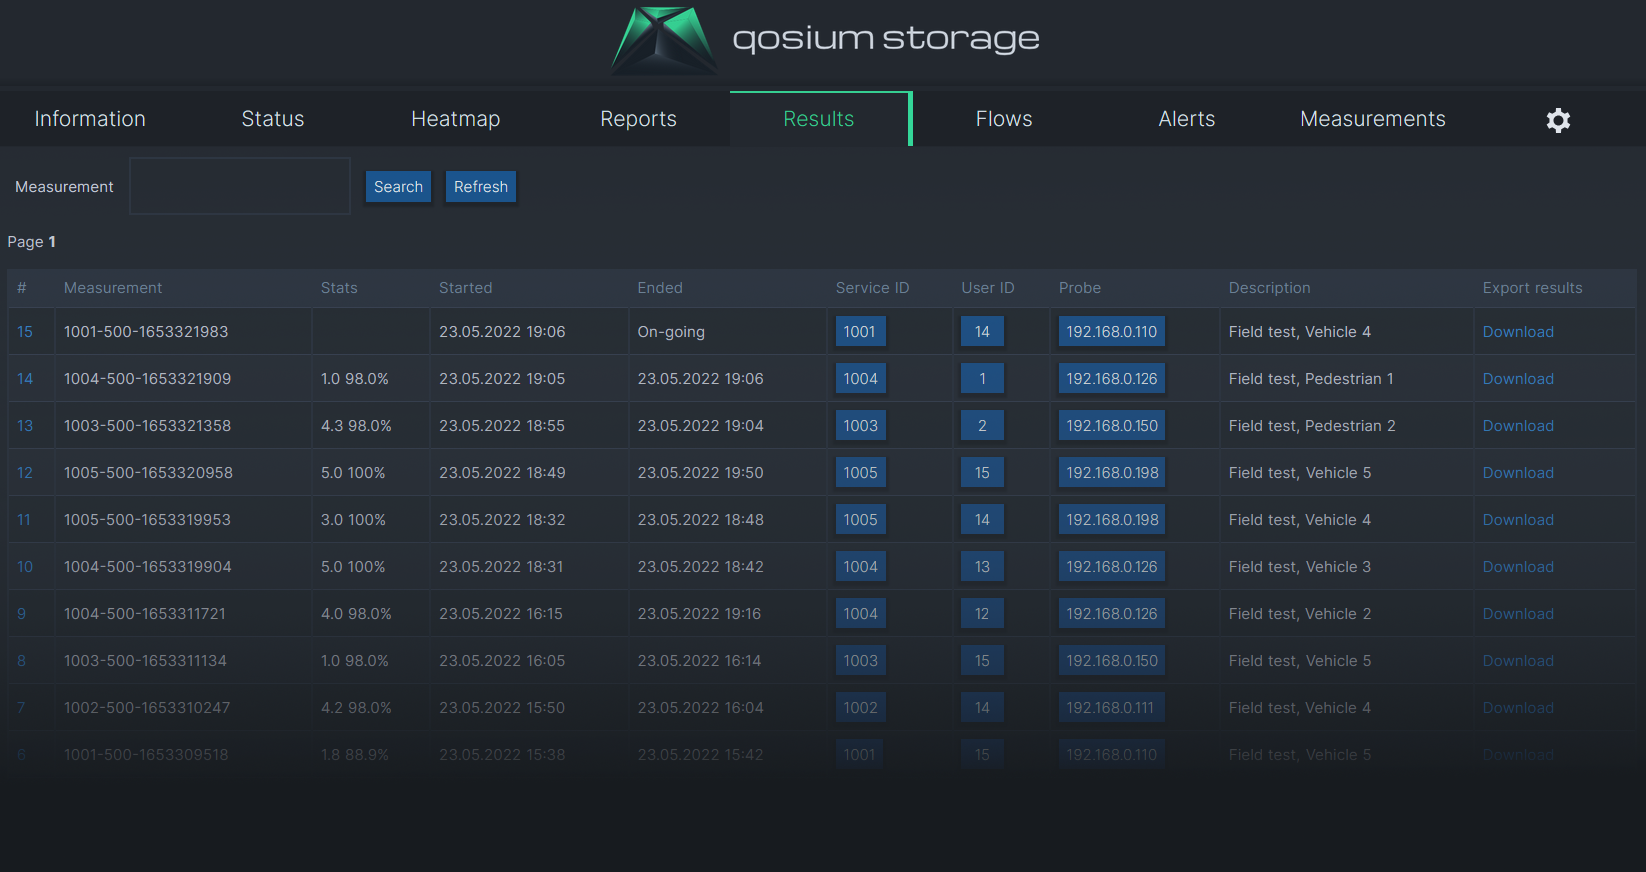
In addition to visualizations and reports, Qosium Storage gives general information about the system status and lists all the stored measurements. You can browse and search results, and analyze the them in a dashboard directly. Accessing raw measurement data and connecting results to external tools is also easy.
Your system can also read Storage’s database directly, connecting Qosium statistics as part of a seamless network management experience. Qosium Storage uses the database in timescale format, enabling the results to be directly visualized by popular tools like Grafana.
Taking Qosium monitoring into use raises network situation awareness to a new level. The crucial difference compared to traditional network monitoring is that while it tells sporadic things about network devices and perhaps the QoS of artificial test traffic streams, it does not reflect well the real QoS of applications and services from the end-user perspective. Qosium tells exactly how users, whether they are humans or machines, see the network quality.
Toolbox
When monitoring, the following components are typically selected in the toolbox:
Measurement agents: Qosium Probe
Measurement controllers: Qosium Scopemon (also manageable in Qosium Storage)
Results system: Qosium Storage or your own system
Like always with Qosium, whether it is about manual measuring or automatic monitoring, Qosium Probes handle almost all the measurement-related calculations, so they need to locate in places where they see the traffic to be monitored. Qosium Probe is typically run in the background as a system service.
Real-time Information Directly for the User
In hands-on measuring, Qosium Scope is typically the preferred solution. In automatic monitoring, the measurement controller typically runs in the background, performing its tasks hidden from the user, especially when using the Qosium Storage for monitoring.
In some situations, however, it can be essential for the user of a network-dependent service to have direct visibility into the quality of the connection. For example, in remote operation scenarios involving heavy machinery, it is extremely important for the operator to have continuous information about the network connection quality to ensure safe operation. Relying solely on the video feed, for instance, does not allow for any reliable conclusions about connection latency.
The Qosium Scopemon measurement controller for automatic monitoring can also be equipped with a simple graphical user interface. The results visualization, for example, through dynamic quality bars tells you the prevailing connection quality directly for your applications. Alternatively, you can also feed your software with the same real-time data.
The Qosium documentation talks more about Scopemon.
Monitoring Scenarios
When deploying Qosium, measurement agents (Probes) are installed in locations that need to be monitored. They can be deployed throughout the network without concern, as they are lightweight and only measure when commanded. When not participating in a measurement, Probes remain in standby for potential future monitoring tasks and consume virtually no resources.
Two key considerations apply to their placement:
Qosium Probes must be able to see the network traffic to be monitored, and
QoS monitoring occurs along the network path between two Probes selected for a measurement.
If monitoring is limited to a single point, the resulting dataset is narrower, and access to one-way QoS results, with a few exceptions, is limited.
Each individual QoS measurement requires one instance of a measurement controller. Ideally, the measurement controller is located on the same device as Probe it uses, though this is not a strict requirement nor is always feasible.
Typically, a single result system manages the entire monitoring setup. In very large setups, multiple result systems may be necessary. In critical environments, duplicating the result system should also be considered.
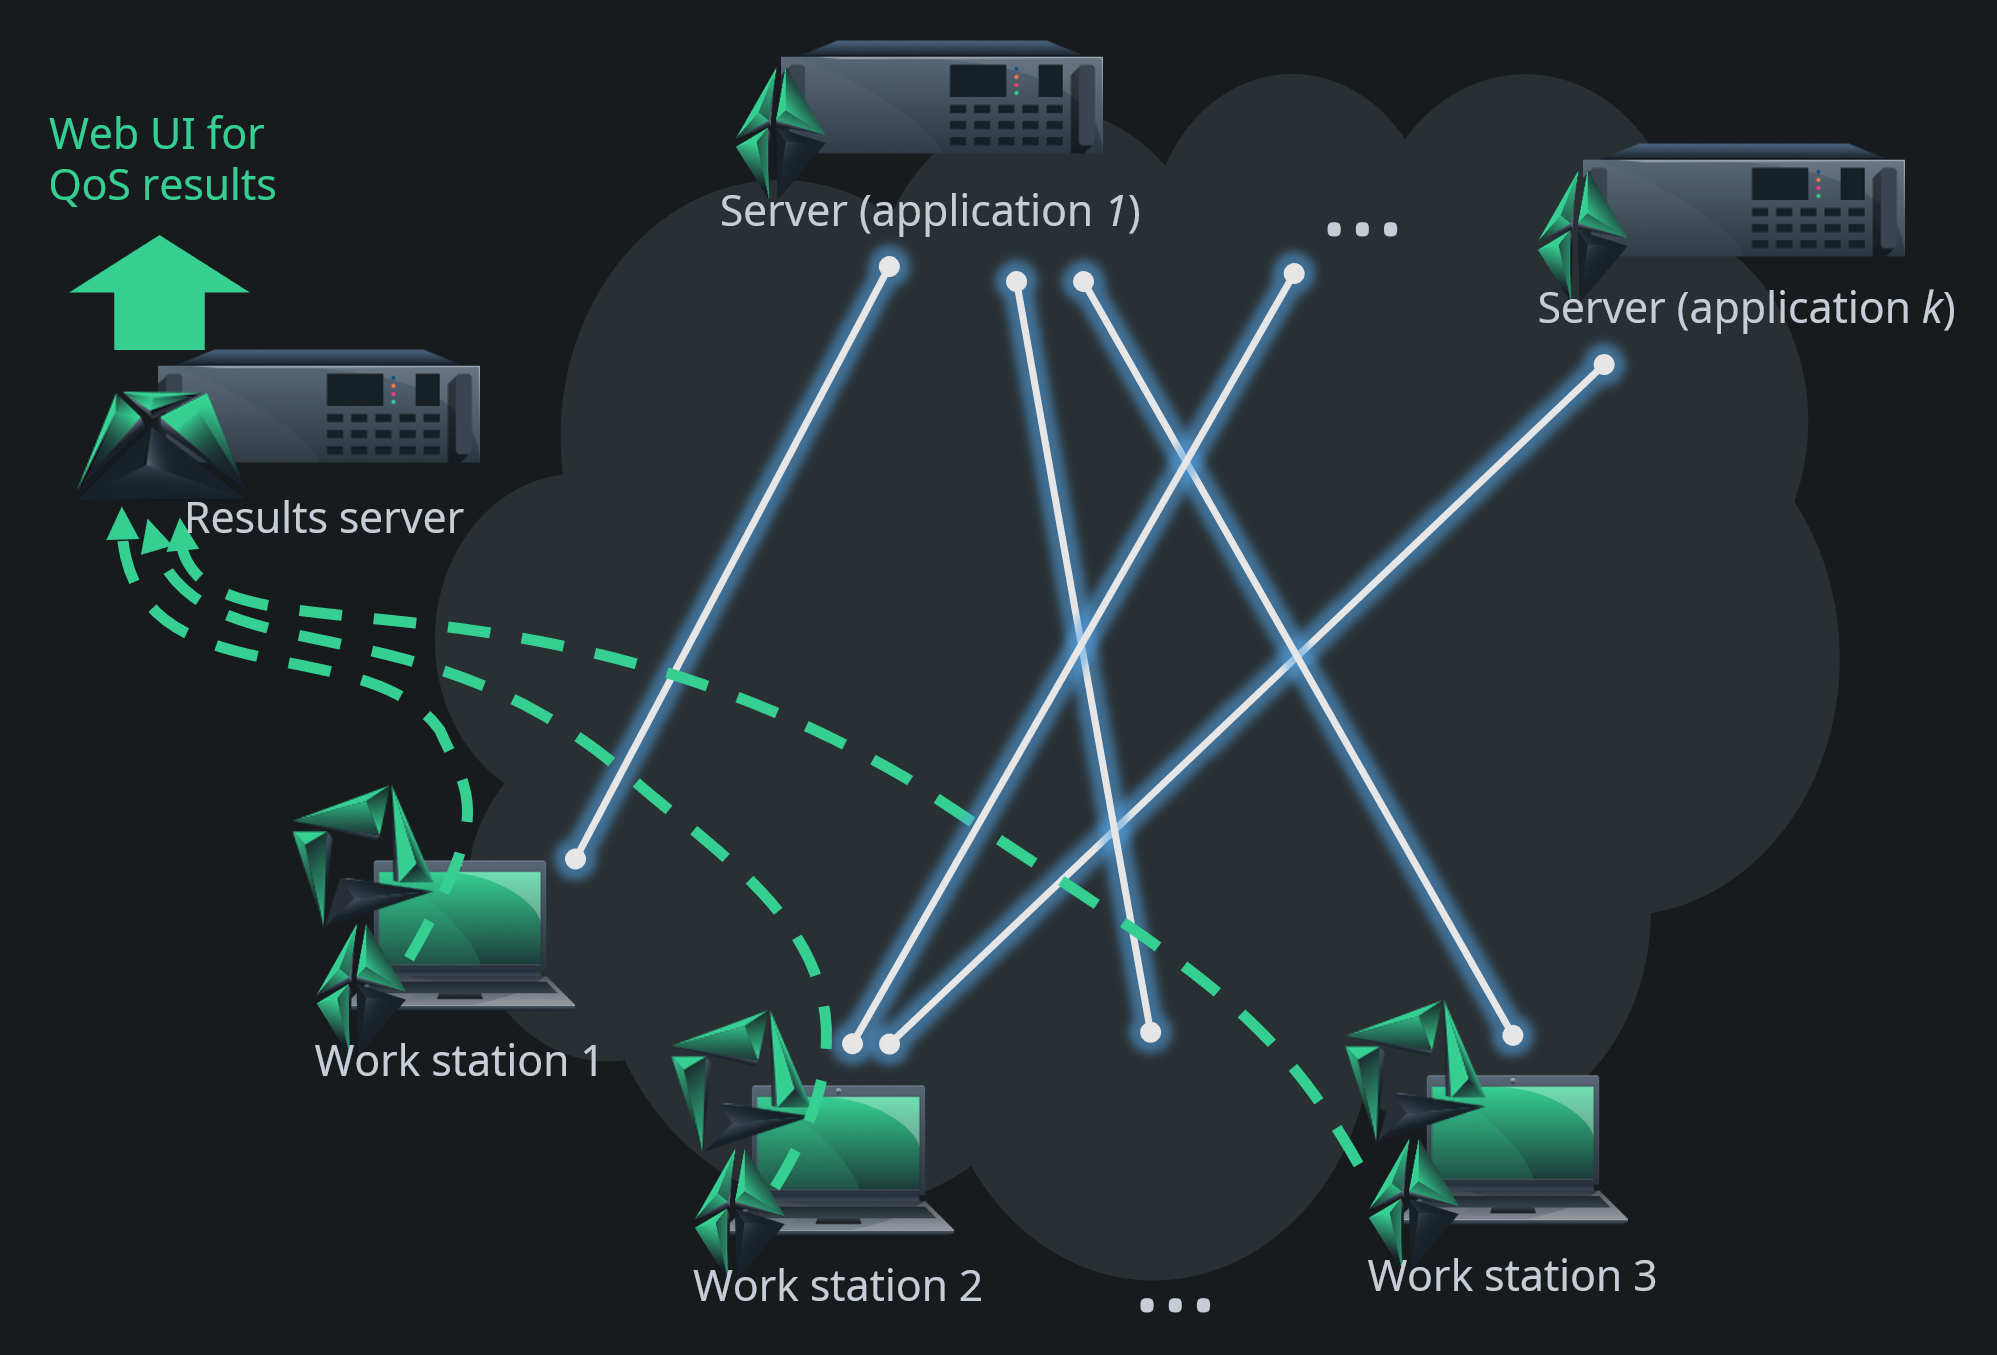
The monitoring setup could resemble the diagram below, where the connections between workstations and application servers are monitored. Qosium Scopemon automatically initiates a two-point measurement whenever a workstation begins using the selected service to be monitored. The results are delivered to Qosium Storage within the same network, allowing the entire network situation to be observed.
In the example above, the connections are monitored end-to-end, but that’s not always the case. The scenario could also monitor only a particular part of the network or even single critical links. Qosium Probe is the one whose location defines the monitoring and measurement possibilities. Thus, it can be installed in various environments on almost all types of desktop and server machines, lightweight end devices, and many embedded systems. We continuously extend Qosium to new platforms and operating systems based on the need.
The document section talks more about Qosium Probe.