
Numerical Tab
The numerical tab in Scope has two sub-tabs: Average results and Packet results. As the names imply, these two tabs show the corresponding result types in numerical table format.
1. Average Results Tab #
This tab displays the average results in a table format. The table has a set of columns that can be selected for view. For more information on the columns and average results in general, see Average Results in Qosium.
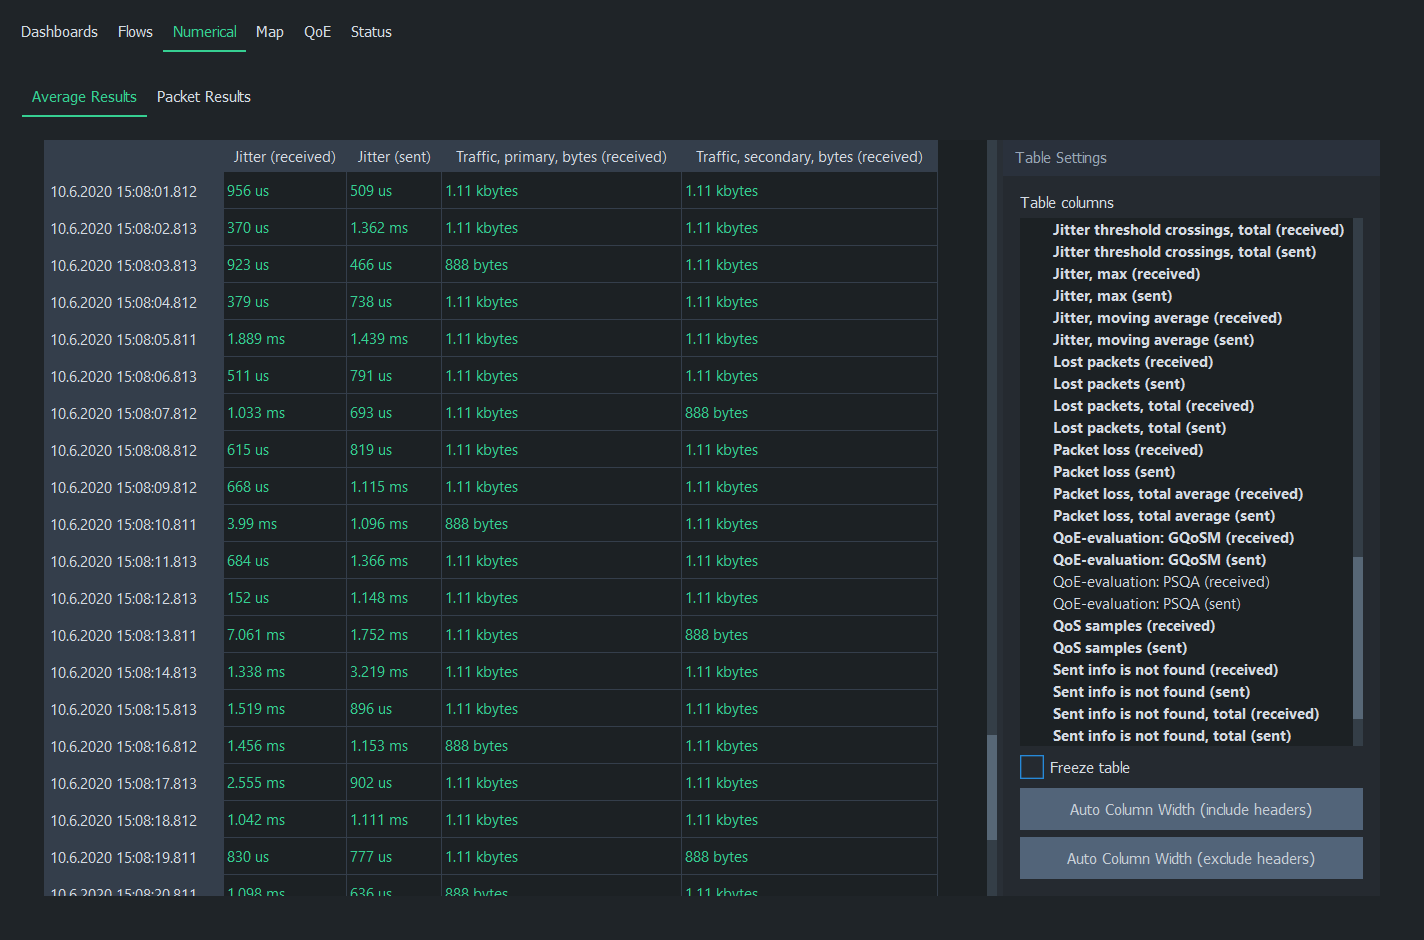
Table columns lists all available average results. Use the blue triangles to expand/collapse each statistics group. Left-click on any statistics to display it immediately in the table as a column. Left-clicking an active statistic again will remove the column. To select multiple statistics, press and drag with the left mouse button. Statistics, which have results, are shown with bold text.
Freeze table stops automatic update of the table. This is especially helpful if there’s a need to study the results in more detail during the measurement.
Auto Column Width (Include Headers) resizes columns according to the widest row. If you want to resize columns without taking the header row’s width into account, use Auto Column Width (Exclude Headers).
2. Packet Results Tab #
This tab displays the packet results in a table format. The table has a set of fixed columns. For more information on the columns and packet results in general, see Packet Results in Qosium.
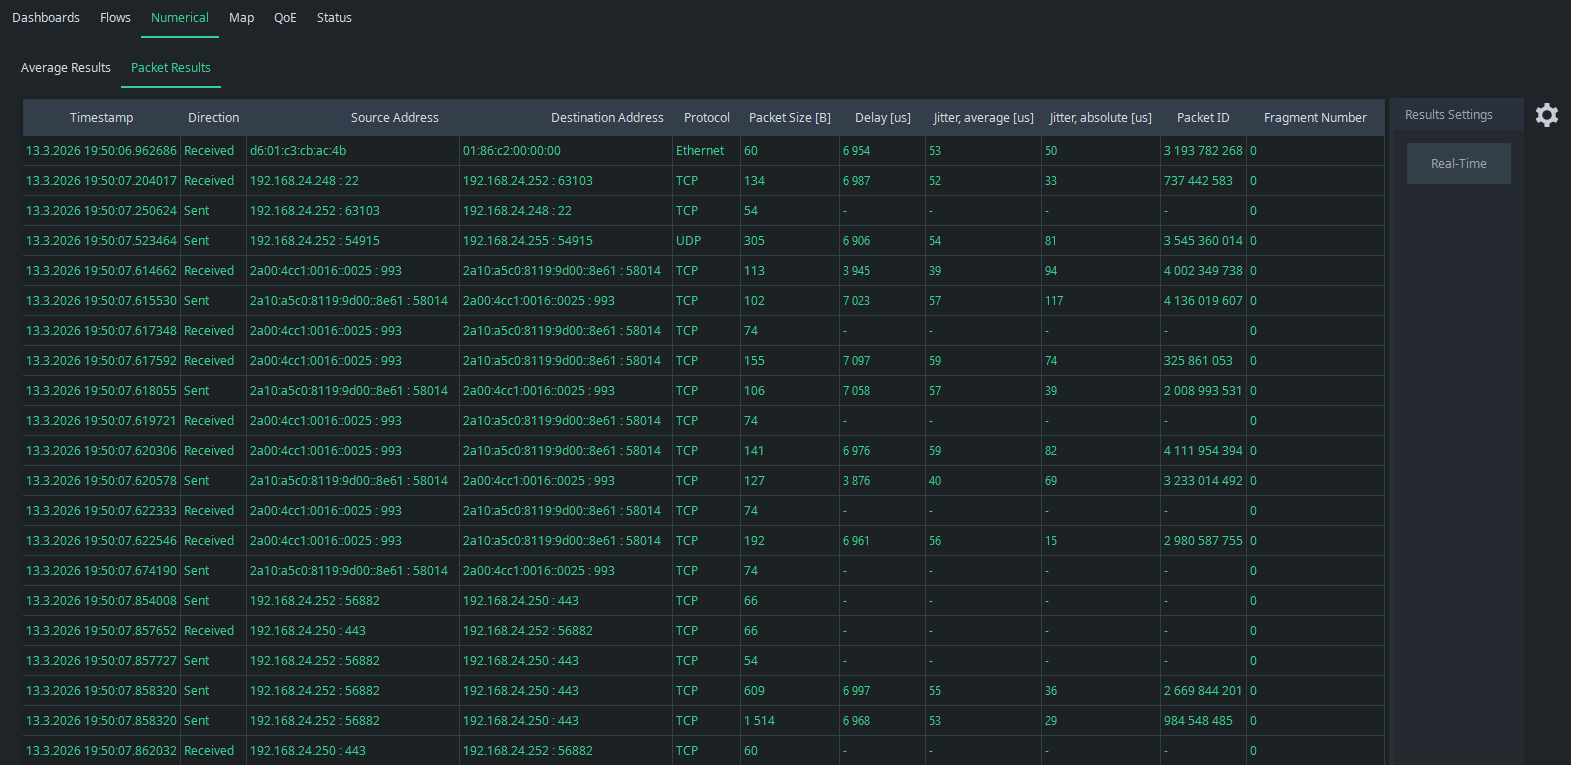
Use Timeline to scroll the results history. Get back to real-time (or the most recent result, when no measurement is running) by clicking the button Real-Time found behind the gearwheel icon on the right.
Suggested Pages
Qosium has four types of results: Average, flow, packet, and pcap results.